Design Policy BeaconWhat is
Design Policy?The importance of Country Analysis
The Design Policy Beacon is built on the basis of a theoretical framework that reads design policy ecosystems through two main tools, the Design Policy Categorisation and the Design Policy Ecosystem of Organizations. These describe what a design policy ecosystem is, and represent the compass that makes sense and helps steer the relationships and roles in the complex system of governance that supports design. In this section, we introduce the rationale behind the DP Categorisation tool and how this can help interpret the set of design policy actions in a country.
A “goal-oriented” taxonomy for design policy actions
The model behind the Design Policy Categorisation adopted in the Beacon guides the recognition of the presence/absence of different types of governmental support for design on the basis of 7 categories of investment and focusing on policy objectives in order to identify the area of intervention as well as to understand who/what is supported .
This type of “goal-oriented” approach has been adopted in order to include a number of support measures that aren't normally taken into account when mapping design policies but are nonetheless relevant especially in those contexts that lack a more structured support scheme (i.e. explicit national policy).
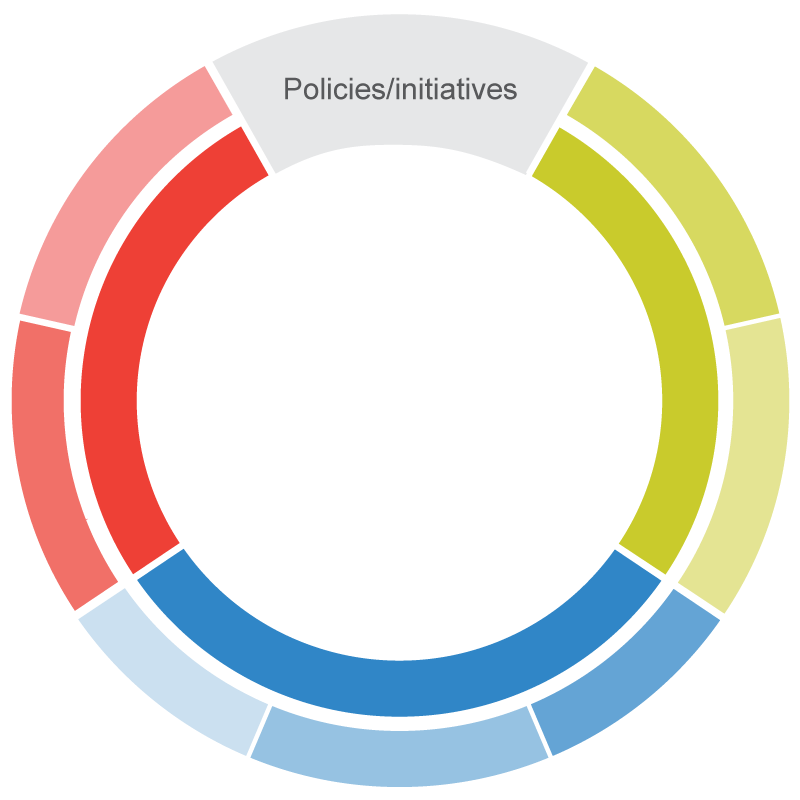
The underlying assumption of our taxonomy is based on three main categories (framework, human, and asset development), and mainly states that a complete system should support design adequately in all three areas. Hereafter, a brief introduction to the meaning of each layer.
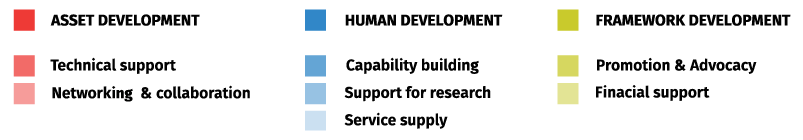
1st category – Human development
Policies that build design capabilities – aimed directly at the development of organizational or individual design capabilities, that support research –directed at improving the quality and applicability of design research, for services supply – measures that enhance the demand of design-related services.
Subcategories:
Capability Building – Measures aimed directly at the development of organisational design capabilities.
Support for research – Measures directed at improving the quality and applicability of research and design.
Services supply – Measures that enhance the demand of design-related services.
2nd category – Asset development
Policies that support technical development - directly addressing technological and technical issues facing organizations, and networking and collaboration – measures to improve connectivity and collaboration.
Subcategories:
Technical support – Empowerment of pre-existing technological assets (hardware), acquisition of new technological assets, and facilitation to acquisition of prototyping services and facilities.
Networking and collaboration – Measures to improve connectivity and collaboration.
3rd category – Framework development
Policies that provide direct financial interventions and measures for promotion & advocacy – aimed at creating awareness of design and the value of design.
Subcategories:
Promotion and advocacy – Measures aimed at creating awareness of design and the value of design.
Financial support – The policy or initiative provides direct financial support for design (organisations or individuals).
Comparing actions on the same scale
Our taxonomy has been designed with broad categories on purpose, so that it could be applied to systems with diverse levels of maturity and richness of actions for design support. As mentioned before, this is important when the support is less structured and explicit, because smaller but still relevant activities might happen at other scales (i.e. local and regional level). However scale it's a crucial variable in this subject matter, that should guide toward comparing systems that are equal (although the definition of equal in this case is not simple – could it be countries of the same size? Countries with similar population? Or with similar GDP?).
Further, more complexity is hidden in the differentiation between types of policy actions. In our framework we consider three different types, each of which might happen at different levels of the design support eco-system:
Policy – as an instrument or a set of rules by which national or regional governments determine and enact rules, activities, and other processes necessary to support design at large.
Programme/Initiative – as smaller actions (e.g. programmes, projects, campaigns, awards, competitions, etc.) derived from a policy (whether this is explicitly about design or more generally about innovation or the creative sector), and designed to achieve part of the objectives of that policy.
Project – as a one-time experimental action launched by the institution/governmental body to test new types of support programmes or acting through/on new subjects.
What is our Ecosystem of Organizations?
The Design Policy Ecosystem of Organizations guides the recognition of the presence/absence of different organizations and institutions that provide design support in your country or region, divided in the five main roles of the design policy cycle (funders, policymakers, intermediary, beneficiary, evaluator), and linked to five main types of organizations (government and governance, advocates, consultancy and professional sector, research and education, demand). The underlying assumption conceptualizes a complete system to be represented and active in all five roles.

The five main roles are:
Funder – Refers to bodies, organisations or groups which have allocated funding for a design policy or initiative. Funders are often not in charge of designing the policy.
Policymaker – Refers to bodies, organisations or groups (e.g. governmental departments, offices, think-tanks etc.) with the responsibility of originating the policy or initiative, determining its rationale, course of action, aims and objectives. They will also generally determine how, and by whom, the policy should be implemented.
Intermediary – Refers to those organisations involved in the implementation of a policy or initiative,
(i.e. by fulfilling its aims and objectives through practical engagement with the intended beneficiaries). In addition, by the nature of their involvement, intermediaries also assist in the promotion and dissemination process.
Beneficiary – Includes individuals, communities or organisations (e.g. enterprises, public sector organisations, associations, even regional or local authorities) that are intended to benefit from the implementation of a certain design policy or initiative.
Evaluator – The term 'evaluator’ includes individuals, experts or organisations that are in charge of evaluating the results and impact of a policy or initiative.
The five main types of organisation are:
Government & Governance – Local or national government, municipalities, governmental institutions and bodies.
Advocates – Bodies that promote and support design nationally and/or locally (i.e. councils, museums, etc).
Consultancy and Professional Sector – The entire design professional sector, including young creatives, design studios, etc.
Research and education – Research and education – Schools and organizations (including training and research centres) that provide education and training about design.
Demand – Individuals, communities and organizations that benefit from design as an external service.
From theory to real users
In order to test its effectiveness, a theoretical model should be put into practice and validated in collaboration with potential users. For this reason, the Design Policy Lab has organized different events to discuss this framework with policy makers, professionals and innovators from different European countries.
An example is “Design Policy in Action – The model of the Luxembourg Design Action Group”, an event held in Luxembourg in March 2016 that has gathered Design for Europe’s ambassadors from Slovenia, Estonia, Hungary, Lithuania, Poland and Portugal.
Also the event “Design and policy making - Design Policy Beacon: a tool of analysis” – held in Milan in June 2016 – was an important moment of dialogue, where Italian experts in policy making were asked to feed back on our the Design Policy Beacon concerning the specific policy frame of Regione Lombardia, in Italy.
Furthermore, since the Beacon’s release, the framework has been applied and reiterated through the development of the Landscape section, especially in the format for Country Analysis, an in-depth inquiry on the design policy landscape/ecosystem of a nation.
While the development of the fully working map and info-visualisation is a constant work in progress where one of the main risks is to avoid rapid obsolescence of data, it is already possible to observe some common patterns. In particular, all the European contexts analysed so far (Denmark, France, UK, Estonia, Lithuania, Bulgaria, Luxembourg, Italy, Austria, Poland, Portugal, Belgium, Hungary, Norway) seem to still have a fragmented understanding of design across different regional and national levels. The majority of countries analysed declares the absence of design from their national/regional strategies for growth, and still struggles to find and build opportunities for design support beyond pilot programmes, with limited budgets and duration.
The Design Policy Beacon has been designed mainly looking at the need to communicate the multifaceted nature of the European design policy ecosystem and to provide evidences and insights to support policymakers in their practice. In this section we share our experience in doing this, by describing the main challenges we have faced in terms of reducing complexity, and by unveiling the rationale that has led us to the current outcome. We focus our description around three key drivers for the development of the platform:
- The need of designing and providing diverse formats to narrate the heterogeneous nature of data found about design innovation policies and ecosystems;
- The provision of these formats to policy makers, so to make them capable of exploring their own ecosystem;
- The importance of finding the right tools to visualise data, that could help readers easily access research results.
Heterogeneous data require heterogeneous formats
The “Landscape section” is the Design Policy Beacon’s main page. Here users can access all information collected following a geographical nexus and by clicking markers on the map. These last are differentiated by colours to represent one of the three publication formats (Country Analysis, Country Profile, Expert Interview).
It is worth noticing that the first two formats (Country Analysis and Country Profile) both offer a broad analysis of national design policy ecosystems, each with different extent, while the latter one (Expert Interview) provides the specific point of view of an expert. The reason for using different publication formats is to better respond to the possible needs of users, but also to the heterogeneous data collected. For example, even national statistical data about design are seldom homogeneous, organized in a structured form or simply derived from the same source, as it was noted also in past research projects — such as The International Design Scoreboard, developed by the University of Cambridge:
“Few nations actively collect design-related data as part of their national statistics. In most nations, design itself tends to fall between different government bodies. Some aspects of design are encompassed in government departments related to culture, media and the arts. Other aspects of design fall under the department responsible for industry, technology or innovation. In either case, specific statistics on design are rarely collected, and when they are, they are not collected with clear definitional precision. The reason for this is self-evident, as most broad definitions of design span the entire spectrum from the creation of new technology through to the generation of individual works using craft skills.” (Moultrie & Livesey, 2009 : 17)
Therefore, a truthful picture of European design policy ecosystem can’t be established solely from these data, but should be built by merging information from different sources, including:
- quantitative data (e.g.: national statistics, data on design sector);
- qualitative data (e.g.: descriptive articles, unstructured interviews)
- desk research and case study
In particular, the inclusion of qualitative data has also implied a close engagement with local experts of design innovation from all over Europe (i.e.: practitioners, researchers): Design for Europe’s network has been instrumental in this sense, as it has given to this research the possibility to access and provide a privileged perspective on local design ecosystems.
Policymakers can use data to explore their design innovation ecosystem
Data coming from official sources can be extremely valuable for the work of policy makers, for example supporting them in the deeper understanding of public problems. However, official statistics often do not seem to respond to these needs and could be made more accessible and useful if the possibility to interact with data was provided:
“The interactivity of the web also opens up new possibilities. It empowers users to find the information they are looking for in complex, multi-dimensional datasets, and to explore questions in ways that the people who originally collected and analysed the data had not intended. Interactivity also helps to visualise complex innovation datasets in ways that are easier to understand for non-technical users.” (NESTA 2016)
Building on this idea, we have translated all cases mapped (i.e.: policy actions and organizations supporting design) in a machine-readable dataset. This can be accessed in a section called “Catalogue”. When users click on items a panel appears, dynamically displaying data and information about that specific action. User can also explore this catalogue through quantitative criteria (e.g.: year, country, beneficiary) or through the categories defined through our analytical framework. In this way policymakers can learn from past experiences and research according to their needs.
The right visualization to communicate your analysis
The use of info-visualisation and data visualisation is growing in many areas, including policy, mainly because “visualisation can improve understanding and has the potential to increase the use of research evidence” (Gatto, 2015: 8). This principle has guided also the choices made to use practically the Design Policy Beacon’s framework, leading us to look for visual representations capable of showing at a glance the structure of a national ecosystem for design support, while at the same time allowing an easy comparison between two or more analysis. Inspired by the sunburst graph, in which “items in a hierarchy are laid out radially, with the top of the hierarchy at the centre and deeper levels farther away from the centre” (Stasko, 2017), the visual appearance ultimately adopted recalls conceptually the principle that a complete system should support design adequately in all three macro areas (framework, human, and asset development).
A constantly evolving process
Due to the risk of rapid obsolescence in the data presented and the continuous search for improvements, the development of the Design Policy Beacon is a constant work in progress. Some challenges have been overcome and some other will follow as the project evolves. We hope that this overview of the design solutions adopted can help others to achieve similar goals of complexity reduction and sense-making.
In the meanwhile, we’d like to hear your feedback.
References
Gatto, M.A. (2015). Making Research Useful: Current Challenges and Good Practices in Data Visualisation. Reuters Institute for the Study of Journalism with the support of the University of Oxford's ESRC Impact Acceleration Account in partnership with Nesta and the Alliance for Useful Evidence. Available at: https://reutersinstitute politics. ox. ac. uk/publication/making-research-useful (accessed March 2016).
Moultrie, J., & Livesey, F. (2009). International design scoreboard: initial indicators of international design capabilities. IFM Management Technology Policy, University of Cambridge. Design Council. Reino Unido.
NESTA (2016). Innovation Analytics, a guide to new data and measurement in innovation policy, accessed on 28th March 2017, available at http://www.nesta.org.uk/sites/default/files/innovation_analytics_report.pdf.
Stasko, J. (2017). SunBurst. Available at: http://www.cc.gatech.edu/gvu/ii/sunburst/ (accessed March 2016).
Design policy aims to accelerate the use and acceptance of design in innovation policies. Here, we introduce you to design policy and begin to explore how, and to what extent, it is being implemented by policymakers and governments across Europe.
Actions for design support can be traced back to the beginning of the 19th century. The first professional craft businesses in Sweden and Finland raised the issue of design as an economic asset to be protected by patent legislation (Bitard & Basset 2008). Since then, objectives and types of governmental actions for design have changed according to the understanding of design itself. From looking at design as an aid to improving industrial artefacts and the aesthetics of objects (including elements connected to their communication), to design as a process and approach for creative problem solving and setting (Mortati et al. 2016).
In recent years the European Commission has defined design as "a driver of user-centred innovation" (EC 2009), advocating for its inclusion in a wide strategy to foster non-technological innovation within the private and the public sectors. By the time these guidelines were drawn, a fragmented landscape of initiatives and programmes for design support has emerged in Europe. Some countries have implemented a national design policy (Denmark was the first in 1997), in line with what Raulik-Murphy and Cawood (2009) defined as "the process by which governments translate their political vision into programmes and actions in order to develop national design resources and encourage their effective use in the country."
The complex European reality, however, is that in the majority of European governments design is still not directly addressed by dedicated investment at a national scale. It is often tacitly and marginally supported in innovation policies and mostly at regional and local levels (with Italy a notable example). What becomes apparent then when studying the ecosystem of design support, is the need for both national and regional/local actions to coexist.
Building on this, an appropriate framework to study design support should look more widely at design policy actions, that is governance actions that "aim at sharing a set of rules, activities and processes to support design through the reinforcement of design capabilities at all levels of the policy cycle" (DeEP, 2014). This definition attempts to acknowledge the complexity of design support through a qualitative process of analysis and methodical understanding.
Though still in its infancy worldwide, the following projects should be noted for having pioneered the design support process:
- The SEE Project has developed a Design Policy Monitor to map the integration of design in innovation policies across Europe.
- DeEP (Design in European Policy) has defined an approach to evaluate design policies effectiveness.
- The Design Policy Beacon, a comprehensive evidence-based online resource for understanding design support in different European ecosystems developed by The Design Policy Lab (Politecnico di Milano).
References
Mortati, M., Villari, B., Maffei, S., Arquilla, V. (2016). Le politiche per il design e il design per le politiche. Dal focus sulla soluzione alla centralità della valutazione. Milano: Maggioli Editore.
Bitard, P., & Basset, J. (2008). Design as a tool for innovation. INNO-GRIPS Mini Study, 5.
European Commission (2009) Design as a driver for user-centred innovation, Commission Staff Woking Paper. Brussels: Commission of the European Community.
Raulik-Murphy G., Cawood G. (2009). National Design Systems – a tool for policy-making. in Creative industries and regional policies: making place and giving space. Birmingham: Research Seminar, University of Birmingham.
AAVV. (2014). DeEP – Design in European Policy. Lancaster: Lancaster University Press.
The “Country Analysis” is both a guideline for analysis and the connected editorial format developed to conduct in-depth investigations on the design policy landscape/ecosystem of a country. It serves the purpose of supporting the taxonomy of design policies in a geographical context, investigating both actions and organizations, while ultimately helping local stakeholders connect the dots with one another.
Why do we consider this central?
Design activities are strongly connected to the strategic directions for development decided by national institutions and should therefore be decided in relation with the trajectories of development of the nation itself. Consequently, understanding a local design ecosystem points to a sensitive and nuanced operation that requires a dynamic and systemic model of interpretation. In fact, too often an over-simplistic understanding of design investments leads to a scenario where “government policymakers are poorly informed about where to best invest national resources to facilitate innovation through design” (Love, 2007: p.5).
More to the point, a policy should be formulated taking in consideration the systemic nature of public issues, in the same way Raulik-Murphy et al. recognize that design policies need to address the whole innovation ecosystem:
“The implementation of design policies requires action from a complex network of stakeholders who have accumulated experience, knowledge, capabilities, and leadership in their own areas. Promoting design demands an integrated approach among these stakeholders whether they are from government, the design community, industry, or academia” (2010: 57).
Building on this basis, the idea of Country Analysis is not only to provide raw data (i.e. a list of policy actions and organizations), but also a resource to read relationships, making sense of the complex network of stakeholders that constitute the design system in a country. We tried to achieve this by bringing together different types of information:
- General statistical data, from governmental sources (e.g.: United Nations Statistics Division, OECD, IMF). These are provided to indicate that macro level indicators like GDP or demographics are crucial to compare similar geographical contexts in terms of scale and characteristics;
- Description from experts. Through a synthetic article, written in collaboration with local experts on design innovation and the connected programmes of support (e.g.: The Design Policy Lab, Design Council, LuxInnovation), we have tried to provide an overview of how a country is supporting design, and of who are the key organisations in that ecosystem;
- Categorization of design policies and organizations. This analysis has been the main challenge that has underpinned the Design Policy Beacon. Design policy actions have been analysed through a theoretical framework, taking into consideration both actions in support of design and organizations involved. This has been analysed visually to be easily understandable.
You can access the Country Analysis currently available on the Design Policy Beacon’s Landscape section, by clicking red markers on the map. At the Design Policy Lab, we are continuously working to enlarge our basis of data and would be happy to involve new partners and experts with this intent. If you want to collaborate, please contact us.
References
Love, T. (2007). National design infrastructures: the key to design-driven socio-economic outcomes and innovative knowledge economies. In (Ed.) IASDR 07 - International Association of Societies of Design Research. Hong Kong: The Hong Kong Polytechnic University.
Raulik‐Murphy, G., Cawood, G., & Lewis, A. (2010). Design Policy: An Introduction to What Matters. Design Management Review, 21(4), 52-59.